

By any metric you look at, software as a service (SaaS) companies are booming.
SaaS IPO’s are happening at a torrid pace, revenue per employee at top SaaS companies has eclipsed $200,000, and the SaaS market as a whole is expected to see a compound annual growth rate of 21% over the next four years.

If you want a more tangible example, just consider the Salesforce Tower in San Francisco. Yep, that’s a SaaS company that built the tallest building west of the Mississippi.
Part of the reason that SaaS companies are so successful lies in the fact that they have an advantageous business model in which revenue is collected on a monthly basis. But, you can’t just snap your fingers and build a company with a predictable revenue stream that grows in perpetuity.
To succeed in the world of SaaS, you have to meticulously monitor your key growth metrics.
That being the case, SaaS leaders are borderline obsessive about tracking their growth. They also tend to be open about sharing their best practices for increasing growth, which is great for the community as a whole (side note: we’ve seen this play true as SaaS founders have been some of the most transparent on our growth podcast Scale or Die).
The industry leaders use software dashboard such as ProfitWell, Chartmogul, and Baremetrics to track their numbers, and every other SaaS company would do well to follow their lead.

Monitoring SaaS growth metrics is important because these companies are like sharks — if they stop moving forward, they die. This is true of all companies to a certain extent, but it’s even more critical that a SaaS company grow quickly. The SaaS world is ultra-competitive, and it’s the fastest growing companies that end up dominating the market. Therefore, keeping your monthly recurring revenue growing faster than your churn is critical.
If you want to win your market, here are the SaaS growth metrics for startups that you need to monitor and optimize:
Churn
While tracking important metrics can be complicated, some aspects of the process are not rocket science. For instance, we all know that churn is really bad.
But what exactly is churn? Most of the times, churn refers to user churn (or customer churn):
User Churn: the number or percentage of customers who stop using your services within a given time period.
But churn can also be calculated as revenue churn:
Revenue churn: the revenue lost from customers who stop using your services during a given time period.
Churn is an especially crucial metric in SaaS because high churn will crush a business where a high number of customers renew their contracts on a monthly or yearly basis. If your churn is too high, you need to figure out why and stop the bleeding immediately.
If you can stop churn, you create breathing room.
And while it’s seemingly straightforward advice, diagnosing churn can prove to be a complex problem. Customers could be leaving for any number of reasons, but special attention should be paid to customer service and product. If you’re not surveying your customers or building for their needs, you could be losing them.
As touched on above, if your churn is rising faster than you are gaining new business, that’s the death knell for a SaaS company.

“Reducing our churn was the biggest lesson that was hammered upon us during our time at Y Combinator. As direct response marketers, we’d mastered the art of paid traffic, but we were failing to see the disastrous effect churn would have for the longevity of our business.”Chris Hull, Co-founder of Proof
Churn rate targets will differ based on the age, size, and industry of your company. For instance, it’s normal for an early stage startup to have higher churn (10-20% range) as they focus on finding Product-Market fit and figuring out how to get their business off the ground.
And in terms of size and industry, more upmarket companies will generally aim for a lower churn rate (when you have fewer customers with bigger contracts — as a percentage, churn should be lower).
But generally, a good industry-agnostic rule of thumb is to aim for a maximum of 5-7% annual churn. Watch this churn target closely — its importance can’t be overemphasized. If you can make shifts to improve customer retention, you’re on the road to SaaS success.
CAC
CAC is a metric meticulously tracked by SaaS growth marketers.
Customer acquisition cost (CAC): It’s the best measurement of how much it costs in marketing and advertising dollars to gain a new customer.
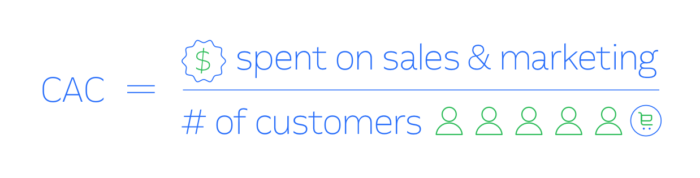
Source: Intercom
The lower your CAC, the more money you have to invest in other aspects of your business — such as hiring awesome team members, buying a nap pod, or investing in new product development.
All jokes aside, CAC is an important number. But why?
If you’re spending more to acquire a customer than they are worth, you won’t be around for the long term. It’s like buying a house you can’t afford.
Sure, you might be able to do it — and maybe you can keep up the payments for a while — but eventually, you won’t be able to make payments, and you’ll lose the house. The same principle applies to customer acquisition.
To better understand CAC, let’s use a quick example.
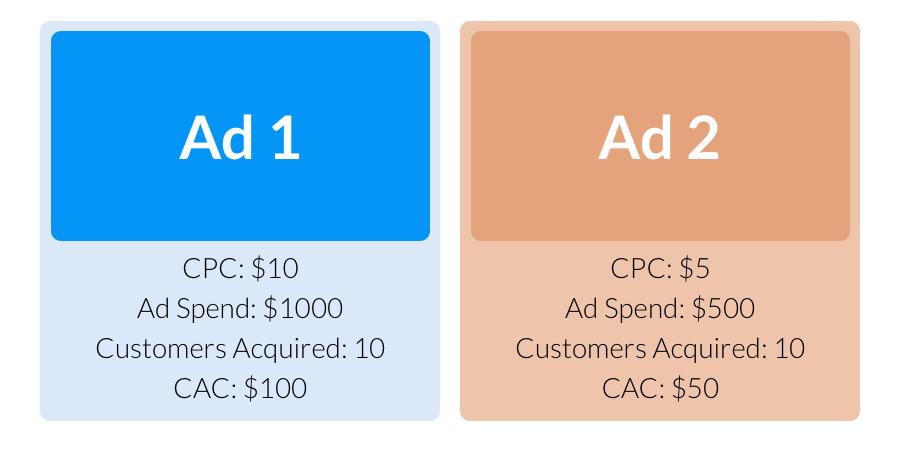
Imagine you’re running two ads, and you pay for 100 clicks on each ad. Ad 1 has a CPC of $10 and Ad 2 has a CPC of $5.
So to acquire 10 customers with Ad 1, you spend $1000. To acquire 10 customers with Ad 2, you spend $500. What’s the CAC on each ad?
On quick glance, Ad 1 has a customer acquisition cost of $100 ($1000 / 10). And Ad 2 has a customer acquisition cost of $50 ($1000 / 20). And while that can be correct, ad cost is not all that goes into CAC — remember that CAC includes all sales & marketing costs that are incurred.
When monitoring CAC, you’ll want to measure it in relation to LTV (more on that later).
Plus you’ll want to keep close tabs on your months to recover CAC, meaning: how long does it take you to earn back the money you spent to get a new user? The quicker you can pay back your ads, the better.
Customer LTV
Customer lifetime value (or customer LTV): The measure of how much in revenue you collect from an average customer over the duration of the business relationship.
By tracking LTV, you get a sense of how much it’s worth to spend on advertising to attract new users and it also gives you (and consequently your investors) a sense of how lucrative each new customer is for your business.
The simplest way to calculate LTV is to use the following formula:
(Average Revenue Per User (ARPU) x Profit Per User)/Churn Rate
In a perfect world, you’ll be able to use customer LTV to figure out how to gain high-value users for the lowest possible ad spend.
LTV to CAC Ratio
Putting the last two metrics together gives you the all-important SaaS metric: the LTV to CAC ratio.
If you’ve ever seen a startup pitch deck, LTV to CAC was surely mentioned in the first couple slides, as it’s a great snapshot of the long term viability of your business. If you are spending a boatload to get users who don’t generate ROI, you’ve got big problems, and LTV to CAC helps frame that issue.
LTV/CAC ratio: The ratio of the lifetime revenue value of a customer to the marketing & sales cost of initially acquiring that customer.
The goal is to spend as little as possible acquiring customers who then go on to generate a lot of monthly revenue growth for the company. A good LTV to CAC ratio to shoot for is 3:1. Or put another way, your target CAC should be ⅓ of your LTV.
A lower ratio (let’s say 1:1) indicates you’re going to lose money. And a higher ratio (for instance 5:1) can mean you’re under investing in marketing. You could be spending more and add meaningful revenue to your SaaS.
Trial Conversion Rate
Many SaaS companies offer free trials because discerning users want to test drive the product before committing their dollars. It’s a key part of our business model at Proof — we want users to try our software, fall in love with it, and stay around as long-term customers and advocates.
Trial Conversion Rate: The percentage of visitors who become paying customers divided by the number of visitors who started a trial.
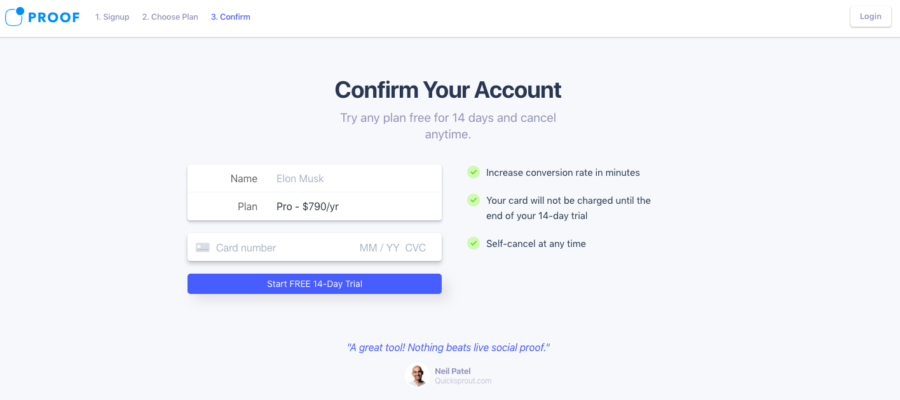
Proof signup page
As a SaaS, you don’t want to be known as the type of company that gets lots of signups only to see people bail at the end of the trial period. If you don’t convert the users that are trialing your product, you won’t gain customers and you’ll be wasting server, customer success, and engineer time, and money to no avail.
"Every business is different, but a healthy SaaS company should aim for a trial conversion rate of at least 25%. And businesses that are growing lightning fast can have conversion rates over 50%."The best way to think of trial conversion rate is by calculating your current rate, setting a benchmark of an ideal rate, and formulating a strategy of how to get there.
ARPU
ARPU is not the catchiest acronym, but that doesn’t make it any less important. ARPU refers to the average revenue per user.
Average Revenue Per User (ARPU): Total revenue divided by the number of users.
It is usually measured monthly, and it is often broken down by cohort, which is a subsection of users grouped by location, age, preferences, etc.
This is useful because you can quickly see what types of users are most valuable and where you need might need to spend some extra time to boost up a specific cohort. Upselling (or cross-selling) is a great way to boost ARPU and to achieve SaaS growth without needing to bring on more users. ARPU is also a key input to calculating LTV for your business.
MRR & ARR
Monthly Recurring Revenue (MRR): Recurring business revenue normalized to a monthly amount.
Or in layman’s terms, the amount of subscription income you receive — viewed on a monthly basis. If you aren’t bringing in a ton of new business, you’re in trouble, and if your MRR isn’t growing faster than your churn, you have to quickly make changes to your business model.
As a basic way to calculate MRR, use this formula:
# of customers x average monthly billing
So if you had 1000 customers paying an average of $100 a month, you’d have $100,000 MRR.
That said, your MRR growth rate is another metric to monitor closely. This is your percent increase in MRR from one month to the next. A good goal for SaaS companies looking to break into the upper echelon is a 10% MRR MoM growth rate.
Your ARR, or annual recurring revenue, is the annualized recurring revenue. To go from MRR to ARR, multiply by 12.
Annual Recurring Revenue (ARR): Recurring business revenue calculated on a yearly basis.
So in our example from above, ARR would be $1.2 million.
Quick Ratio
The quick ratio, which is new MRR divided by lost MRR (the dreaded monthly churn), gives you a sense of how efficiently you are growing.
Consider two scenarios:
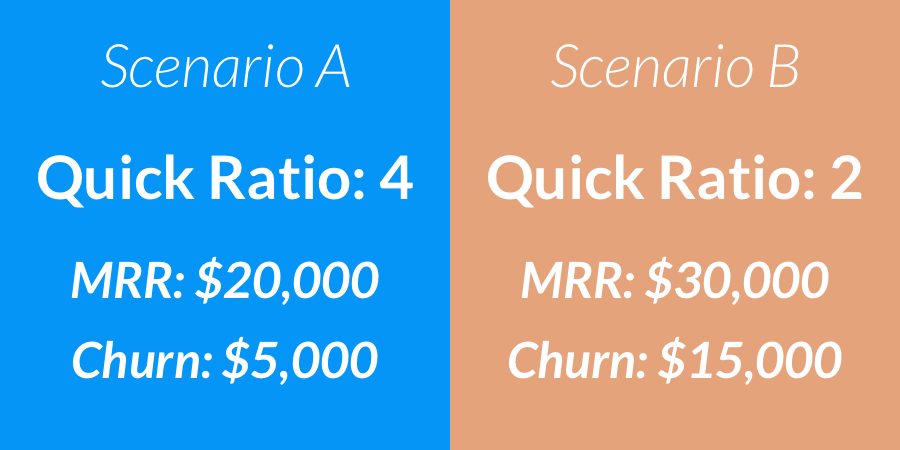
A: You have $20,000 in MRR and $5,000 in churn, for a quick ratio of 4.
B: You have $30,000 in MRR and $15,000 in churn, for a quick ratio of 2.
Both scenarios result in $15,000 in new revenue per month, but scenario A is much more efficient since you don’t have to bring in as much new business to achieve the same level of SaaS growth.
Quick ratio: Ratio of new Monthly Recurring Revenue to lost Monthly Recurring Revenue.
As a rule of thumb, the higher the quick ratio, the better! The quick ratio is a financial metric that can give you a “quick” picture of your company’s growth.
Expansion Revenue
Expansion revenue tracks how much you are able to make on upgrades. For instance, a customer might start out with a basic subscription but then upgrade to a premium subscription. While this is more of a priority at the enterprise sales level, every business should be looking for opportunities to get more value out of their existing customers.
Expansion Revenue: A metric used to measure additional revenue coming in from current customers.
The fastest-growing rocket ships can reach a state of “negative churn” where they are earning more in expansion revenue from existing customers than they are losing from clients who leave.
MQLs and SQLs
SaaS businesses do not have unlimited resources, so they need to make sure that their sales and marketing efforts are reaching out to prospects in a targeted fashion.
The ‘QL’ of this acronym refers to a qualified lead. These are potential customers that have been vetted by a member of your sales team (SQL) or your marketing team (MQL.) You can’t grow your business if you don’t have a steady flow of new, highly interested buyers. For enterprise-level products, sales teams rely on an influx of quality leads, and SQL and MQL are a good indicator of this health.
Marketing Qualified Lead (MQL): Inbound lead qualified by a member of the marketing team.
Sales Qualified Lead (SQL): Inbound lead qualified by a member of the sales team.
Once you have a handle on your MQLs and SQLs, you can start looking at what percentage of your qualified leads turn into customers. That will give you a good idea of how much revenue you have in your sales pipeline — and how predictably you can go grow your business.
If you want to take it to the next level, you can also measure your lead velocity rate. This represents your growth in qualified leads month over month. If your lead velocity rate is increasing, it’s a great sign that you have a lot of growth on the horizon.
PMF Scoring / Customer Happiness
None of the above metrics matter if your customers don’t like you.
In the end, the age-old adage stands: “the customer is always right.” If they are letting it be known that something about your business is not clicking with them, you have to do everything you can to change that. The key metric to building a happy customer base is to make sure that you have the almighty product-market fit (PMF) in place before you start to scale.
Product Market Fit (PMF) Score: A measure of how well a product satisfies a market’s desire.
Marc Andreessen defined product market fit as “being in a good market with a product that can satisfy the market.” While that’s a bit vague, it gives a sense of what all SaaS companies should be striving for. There are ways to measure if you are close to PMF, such as having your customers rate how disappointed they would be if your product did not exist. David Cancel of Drift practices this religiously and we monitor this internally at Proof. The more disappointed they would be, the more likely it is that you have a SaaS company that is going to achieve hypergrowth.
Mastering SaaS growth metrics is a key to success
As the legendary management consultant Peter Drucker put it, “you can’t manage what you can’t measure.” Meaning, measurement is key to making the improvements that will help grow your business. Nowhere is this adage truer than in the world of SaaS. Meticulous measurement leads to quick updates to things that aren’t working, which leads to faster growth. And in SaaS, growth is king.
By tracking this cheat sheet of metrics, you can make mission-critical decisions that can help take your company to the next level. A company that isn’t data-driven won’t grow, and a company that doesn’t grow fast enough won’t survive. It’s definitely hard to find product-market fit and to build a business, but the spoils for the winner make it all worth it.


